College Admissions Tips and Guidance
Trends in College Admission and Counseling

Explore Our Articles
Recent Posts


Popular Categories
Get In Touch
On Social
By Phone or Text
(617) 734-3700
By Mail or Email
1678 Beacon Street
Brookline, MA 02445
By Form
Educational Advocates
Our objective is to guide the family in finding options where the student will not only get admitted, but thrive and find success once on campus.
Trends in College Admission and Counseling
 Each year, the National Association for College Admission Counseling (NACAC) publishes an overview of trends in college admission and counseling (see methodology at the end of this article). Here are highlights from the recently published 2018-2019 survey.
Increase in the number of applications continues. Between Fall 2017 and Fall 2018, freshmen applications increased by 6 percent, transfers by 2 percent and, despite reports of declining interest by international students, their applications increased by 7 percent. However, transfer applications to public institutions decreased by an average of 1.7 percent where private colleges experienced a 4.7 percent increase. Although overall college enrollment is declining and the number of projected high school graduates is expected to decrease, students are still applying to many colleges.
The percent of students applying to seven or more colleges remains steady. The Higher Education Research Institute’s The American Freshmen report series indicates that 36 percent of first-time freshmen applied to seven or more colleges during the Fall 2017 admission cycle. (Since 2014, this percentage has been between 35 and 36 percent). Since 2013, over 80 percent of first-time freshmen applied to at least three colleges per year. We find that most of our clients file between 10 and 12 applications.
Admission staff read many applications. The average number of applications read by each admission officer for the Fall 2017 admission cycle was 1,035 for public institutions and 461 for private institutions. That is a lot of reading, which is why it is essential for students to write compelling essays and activity descriptions in their applications, and prioritize what additional information to include, if any. It frustrates admissions officers to read unnecessary detail.
Overall acceptance rates are up. The US Department of Education reports that the national average acceptance rate for first-time freshmen across all four-year institutions was 66.7 percent in 2017, up from a low of 63.9 percent in 2012. The average acceptance rate at public institutions was 6 percent higher than at privates (70.3 percent versus 63.9 percent). Nearly two-thirds of first-time, full-time freshmen (65 percent) enrolled in colleges that admitted between 50 percent and 85 percent of applicants. Despite the talk about how hard it is to get admitted to college, there are still many seats available.
More selective colleges enroll fewer US high school graduates than you might expect. Those colleges that accept less than half of all applicants received 37 percent of all Fall 2016 applications but enrolled only 21 percent of first-time undergraduate students. Admitted students may have been offered more preferential merit or need-based aid elsewhere.
Early decision applications continue to grow. Between Fall 2017 and Fall 2018, early decision (a binding arrangement where the student applies early to a college and is committed to attend if accepted) applicants increased by 11 percent, and their admit rate increased by 10 percent. A significant percent of our clients apply early decision, which sometimes confers an advantage depending on the strength of the applicant and the overall selectivity of the college.
Early Action (EA) applicants are also admitted at higher rates at some colleges. Colleges with lower yield rates (the percent of students who attend if accepted) were more likely to offer an early action application (when a student applies to a college early but is not committed to attend if admitted). From 2017 to 2018, early action applications increased by an average of 10 percent and EA admits increased by 9 percent. EA applicants were admitted, on average, at 73 percent compared to 64 percent for the regular applicant pool. Bear in mind that some very selective institutions such as University of Virginia and University of Chicago offer early action along with early decision, and the admission rates are not as favorable at such colleges as the data above might suggest.
Offers of wait list increase…yet not many are admitted. For the Fall 2018 admission cycle, 43 percent of all colleges used a wait list. Forty-eight percent of private institutions used a wait list compared to 34 percent of publics. Initiation of a wait list increased by 18 percent between 2016 and 2017, and by 12 percent from 2017 to 2018. However, on average only 20 percent of students were accepted from a wait list, and at colleges that accept fewer than half of their applicants, only 7 percent of wait listed students were admitted. For this reason, it is healthiest for students to focus on the colleges to which they have been admitted even if they choose to remain on a wait list.
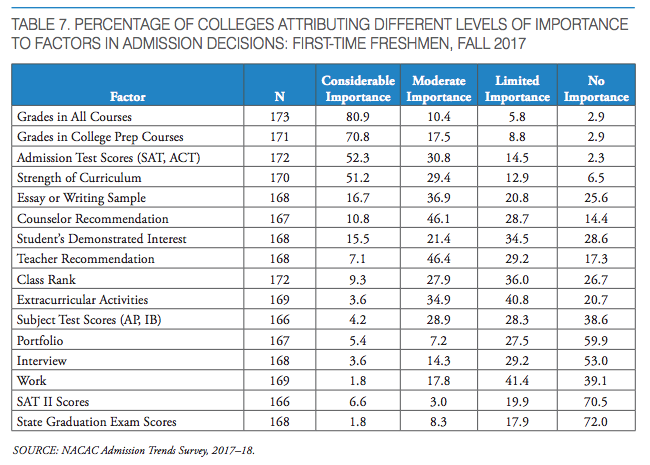 Grades and strength of curriculum remain the most important factors in admissions decisions (see Table 7). Seventy-five percent of colleges rated grades in all high school courses as considerably important, and strength of curriculum was rated considerably important by over 60 percent of colleges. Students must develop a list of colleges that are in line with the rigor of their chosen curriculum and will find there are many excellent options.
Test scores still matter at many colleges (see Table 7). Almost half of colleges gave the SAT and ACT scores considerable weight. For those students that feel standardized tests do not reflect their strengths this means that more than half of colleges put less emphasis on scores, so don’t despair.
A smaller set of more selective colleges prioritize additional factors. Colleges that admit less than 15 percent may care more about AP and IB exam scores, portfolios, SAT Subject test scores, interviews, and extracurricular and work experience. This will vary from college to college and we guide our clients in understanding the distinctions.
Preferences vary between privates and publics, small vs. large. Private colleges place more importance on essays and writing samples, interviews, counselor and teacher recommendations, demonstrated interest, extracurricular activities, and work experience. Overall, public colleges valued admission test scores more highly than private institutions. Smaller colleges care more about the interview, teacher and counselor recommendations, and demonstrated interest. Larger colleges are more apt to emphasize SAT and ACT scores. Again, this will vary from school to school.
School counselors maintain heavy workloads. In the USA, on average, each counselor is responsible for 455 students. In Massachusetts, the average counselor caseload is 411, however, in many more affluent suburbs the caseload is closer to 200 which reflects the inequality in our public education system. In 2018-2019, on average, public school counselors in the USA spent 19 percent of their time on post-secondary counseling, while private school counselors spent 31 percent of their time on college counseling.
Methodology
2018-19 NACAC Admission Trends Survey
- Surveyed admission and institutional research offices at 1,266 four-year colleges
- Received 447 partial and complete responses
2018-19 NACAC Counseling Trends Survey
- Surveyed 15,997 secondary schools ending in grade 12
- Received 2,345 responses
To discover additional information about our services and learn how the best college admissions consultants can assist your family click here.